The annual release of the BP Statistical Review of World Energy gives a first assessment of how the Global Carbon Budget’s 2016 emission projection fared. In short, it did well.
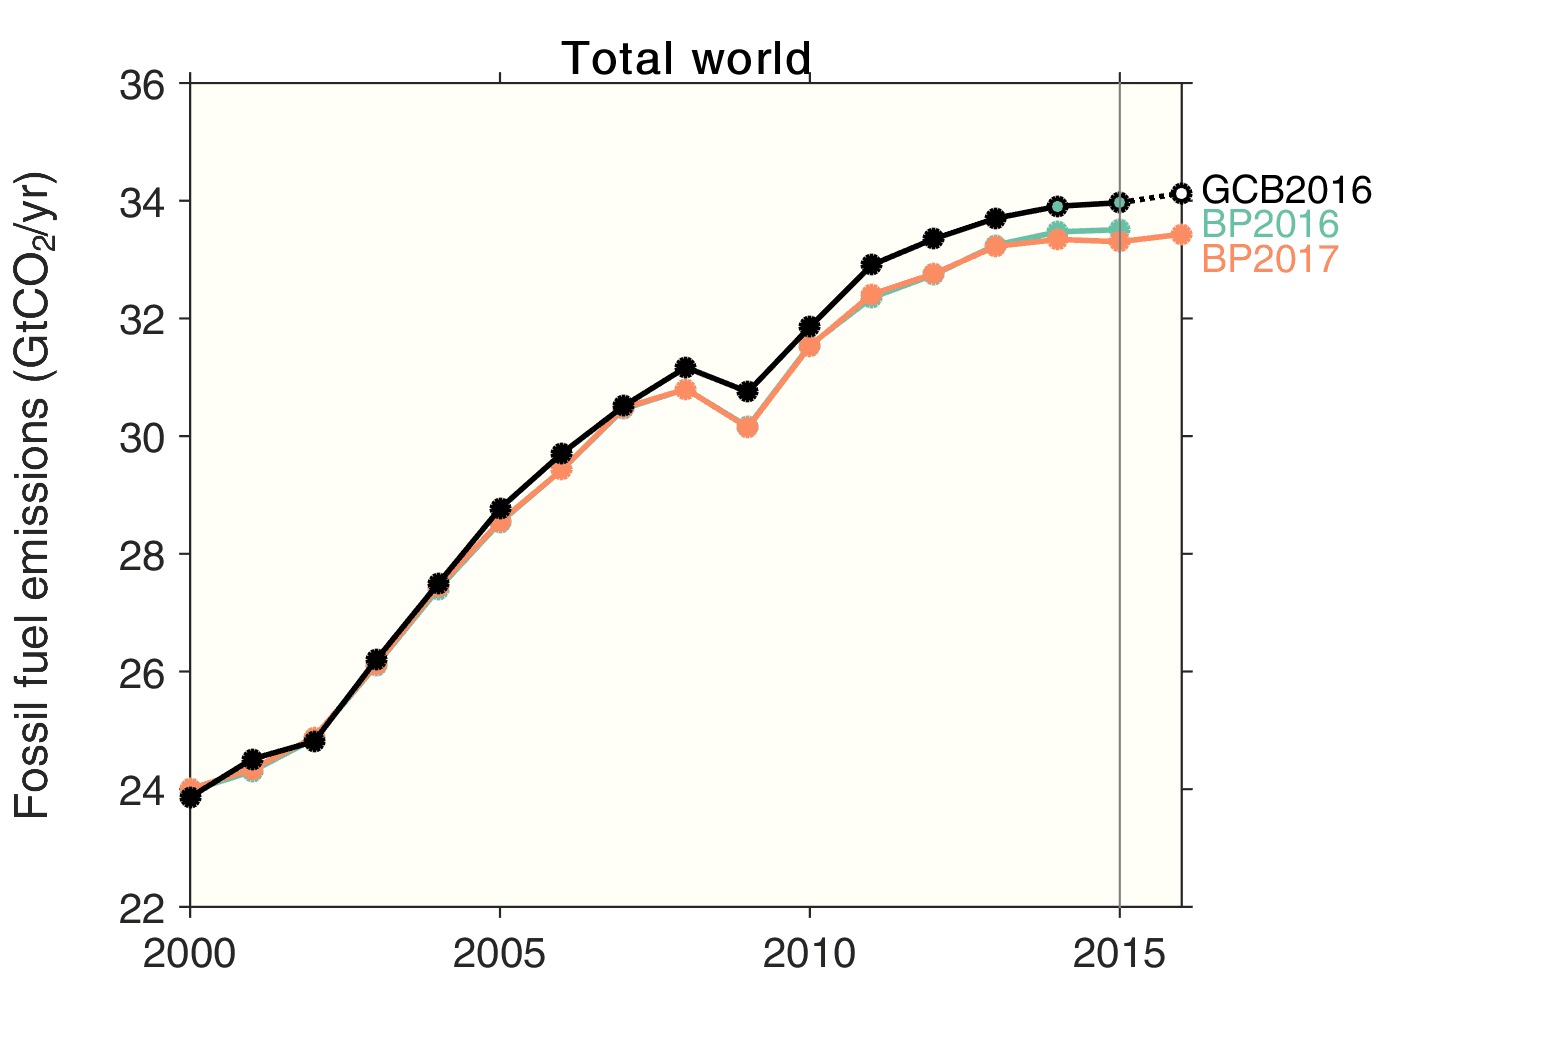
The global carbon dioxide emissions from fossil fuel combustion reported by BP in June 2016 (green), in June 2017 (orange), and by the Global Carbon Budget in November 2016. The Global Carbon Budget emission estimate used UNFCCC data for Annex I (developed) countries until 2014, CDIAC for non-Annex I countries until 2013, and projected emissions forward until 2015 using the latest release of the BP energy data (shown by the green circles) and to 2016 using a variety of methods (white). BP only estimates emissions from fossil fuel combustion (excluding cement production), and we therefore only report Global Carbon Budget results for fossil fuel combustion.
Around November every year we release the Global Carbon Budget, updating the latest trends in the global carbon cycle, particularly trends in the emissions of carbon dioxide.
Unfortunately, the most recent emission estimates are often two or more years old, making the assessment of recent trends difficult.
Consequently, we routinely make projections for the current year’s emissions, even though the year is not yet complete. This gives policy makers and civil society almost real time estimate of emissions, facilitating a healthy discussion on progress. Scientifically, it also allows us to understand how well we understand emission drivers.
The annual release of the BP Statistical Review of World Energy, which provides updated data, gives a first assessment of how the Global Carbon Budget’s 2016 emission projection fared.
The global carbon dioxide emissions from fossil fuel combustion reported by BP in June 2016 (green), in June 2017 (orange), and by the Global Carbon Budget in November 2016. The Global Carbon Budget emission estimate used UNFCCC data for Annex I (developed) countries until 2014, CDIAC for non-Annex I countries until 2013, and projected emissions forward until 2015 using the latest release of the BP energy data (shown by the green circles) and to 2016 using a variety of methods (white). BP only estimates emissions from fossil fuel combustion (excluding cement production), and we therefore only report Global Carbon Budget results for fossil fuel combustion.
Projections for 2016
Over the years, we have gradually refined our methods. Since 2015, we estimate Chinese emissions using preliminary monthly data from a variety of sources, US emissions using official monthly data from the US Energy Information Agency, and the rest of the world using a simplified form of the Kaya Identity.
Our previous projections for current year emissions have been reasonable, but by no means brilliant. In 2015, we estimated global emissions to decline 0.6% due to a in Chinese emissions of 3.9%. But, global emissions grew 0.05%, since Chinese emissions 0.7%. We underestimated the growth in Chinese emissions.
In 2016, we estimated emissions to increase 0.2% after a leap-year adjustment*, with a range -1.0% to +1.8%. BP estimated a 0.1% increase. Our estimate was for emissions from fossil fuels and cement, but we have assumed the growth rate is the same with and without emissions from cement production.
For China, we estimated fossil fuel emissions to decrease 0.8% after a leap-year adjustment*, and BP estimated a 0.7% decrease.
For the USA, we estimated fossil fuel emissions to decrease 1.7% after a leap-year adjustment*, and BP estimated a 2.0% decrease.
This year, our projections have been accurate. Perhaps just luck? Time will tell.
*Leap year adjustments: Since a leap year has 366 instead of 365 days, the growth rate is adjusted downwards by 0.27 percentage points in a leap year (2016) and upwards by 0.27 percentage points in the year after the leap year.
Why do emission estimates differ and change?
Looking at the global emissions, the Global Carbon Budget estimates are higher than those of BP, and BP revises its data every year.
Global Carbon Budget
The Global Carbon Budget emission estimates are taken from a variety of sources, with the philosophy of providing the most accurate emission estimates available given the available resources. This comes at the expense of consistency, which is obtained by using only one dataset.
The core of the Global Carbon Budget database are estimates from the US Carbon Dioxide Information Analysis Center (CDIAC) which cover the time-period 1750 to 2013 at the country level. We overwrite some of the CDIAC data using UNFCCC National Inventory Reports for developed countries from 1990 to 2014, and we project emissions forward until 2015 using the latest release of the BP energy data.
The Global Carbon Budget fossil fuel emission estimates are higher than those of BP, but well within uncertainties (±10%, one standard deviation). The differences are not unexpected given different energy consumption datasets and different methodological assumptions.
BP updates
The BP emission estimates reported in the 2016 data release and the 2017 data release show small differences in the most recent years, which is to be expected as updated data is constantly published.
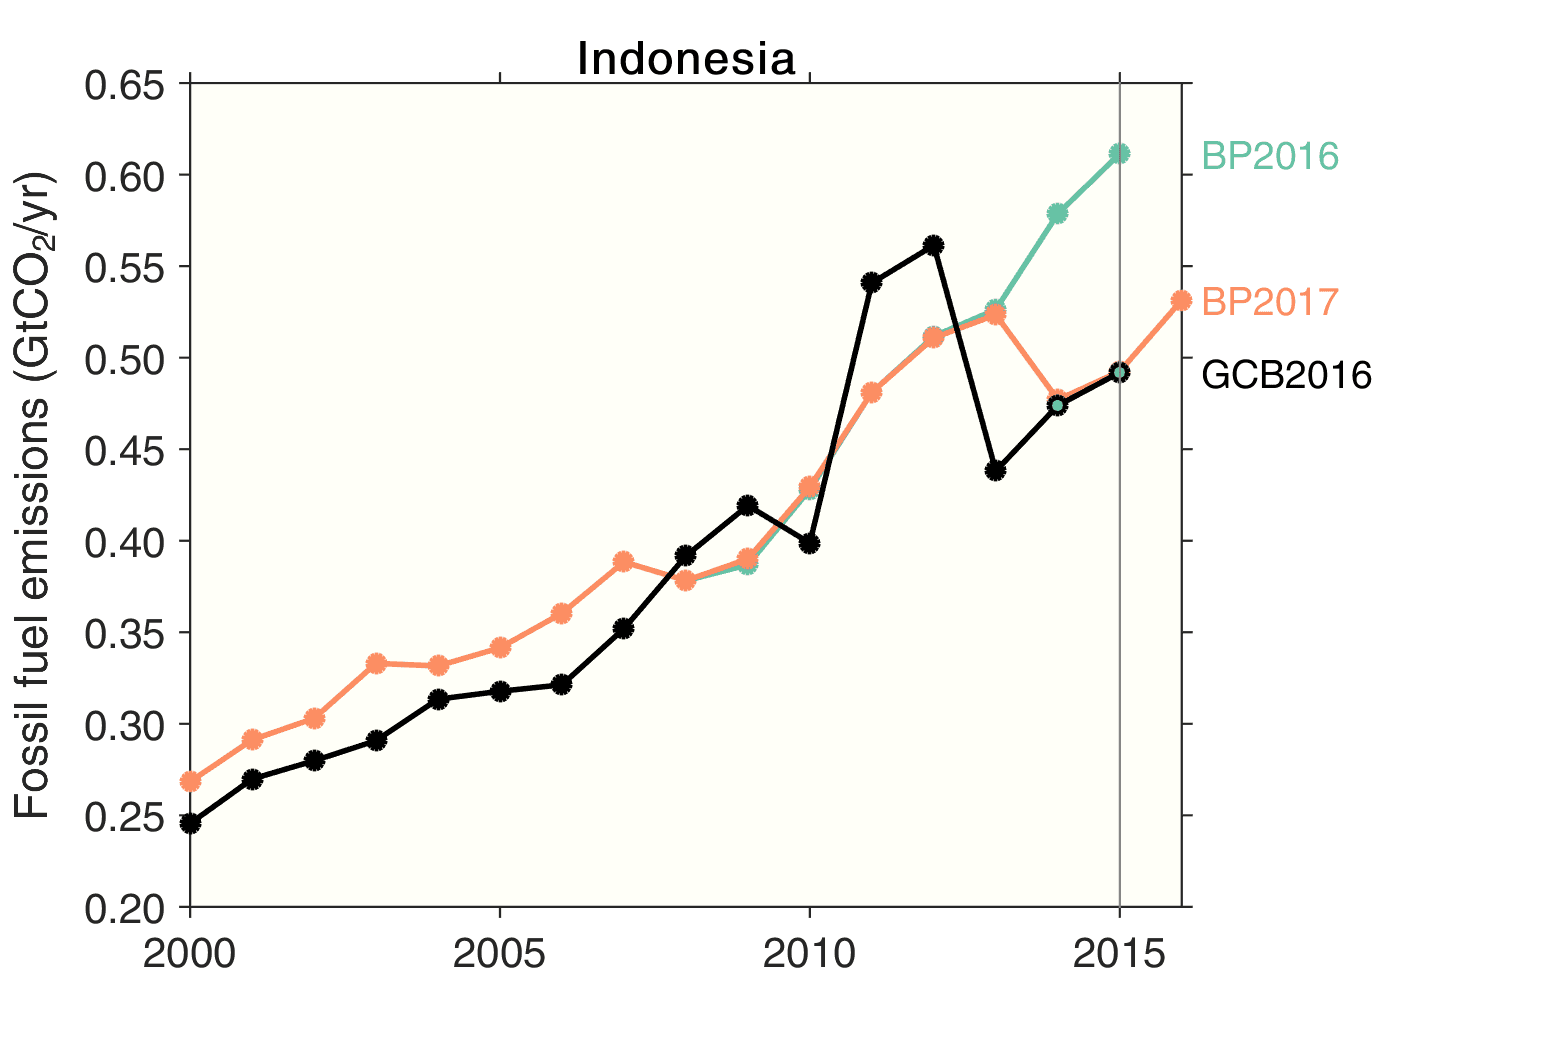
BP’s 2017 global carbon dioxide emission estimate for 2015 is 204MtCO₂ lower than reported in 2016. Of that difference, Indonesia accounts for a 119MtCO₂ decrease, India a 61MtCO₂ decrease, US a 41MtCO₂ decrease, and a variety of other countries have progressively smaller changes (both positive and negative).
In this year’s BP data release, there was a rather drastic change in Indonesian coal consumption, hence emissions. The Global Carbon Budget (using CDIAC data) estimate of Indonesia emissions is also rather erratic.
In the case of Indonesia, the large variations in emissions likely originates since most of the coal extracted in Indonesia is exported, making it hard to estimate how much coal is used domestically. This problem arises in many countries (including Norway) that have a high share of fossil fuel exports related to fossil fuel extraction.
The erratic nature of Indonesia carbon dioxide emissions, driven by uncertainty in coal consumption data, is not common in other countries.
Improving emission estimates
Ideally, we would use emission estimates provided by the countries themselves, as they have the most detailed data. This is our approach for developed countries, where we use official UNFCCC National Inventory Reports, which also undergo a verification process.
Developing countries do not need to report National Inventory Reports to the UNFCCC, but many do provide official emission estimates, either in their National Communication or their Biennial Update Report. However, these estimates are generally at irregular intervals and difficult to access with each country publishing the data in a variety of formats in text documents.
Indonesia has provided emission estimates to the UNFCCC for the period 2000-2012 in its Biennial Update Report, but the emissions data are spread over numerous tables making automated access impractical. The same issue applies for most official developing country emission estimates.
Consequently, we use data from third party sources (such as CDIAC and BP) where annual data is available for all countries in an accessible format. Verification is performed by comparing across independent emission estimates (e.g., from EDGAR or IEA), but uncertainties can be persistently large as for Indonesia.
As more countries take on emission pledges under the Paris Agreement, the importance of accurate emission estimates increases, as does the need for independent monitoring, reporting, and verification.
It is unclear when, and at what detail, developing countries will be required to provide emission estimates under the Paris Agreement.