Can we trust emission statistics?

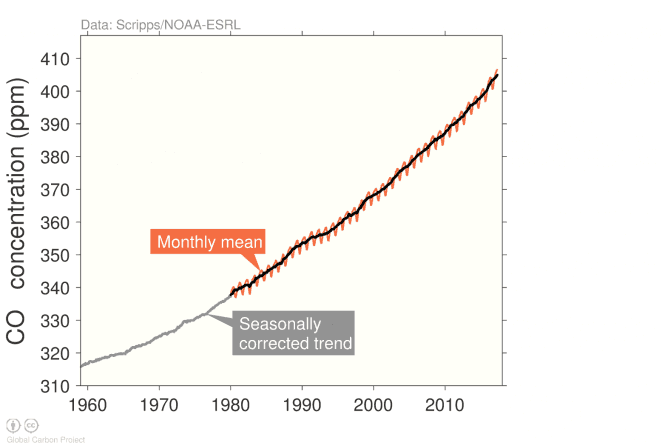
CO₂ concentrations have a well-known seasonal cycle (red) since there is more vegetation in the northern hemisphere, but the CO₂ concentration is continuously rising with our CO₂ emissions (grey/black).
It is one of those issues that drives me nuts. Any comment on the slowdown in the growth of CO₂ emissions is followed by a response that the data must be bogus, because CO₂ concentrations have had a record increase.
Perhaps emissions statistics are bogus, but the record growth in CO₂ concentrations does not show that.
Emissions versus concentrations
Before we get to the details, we need to clarify a few terms:
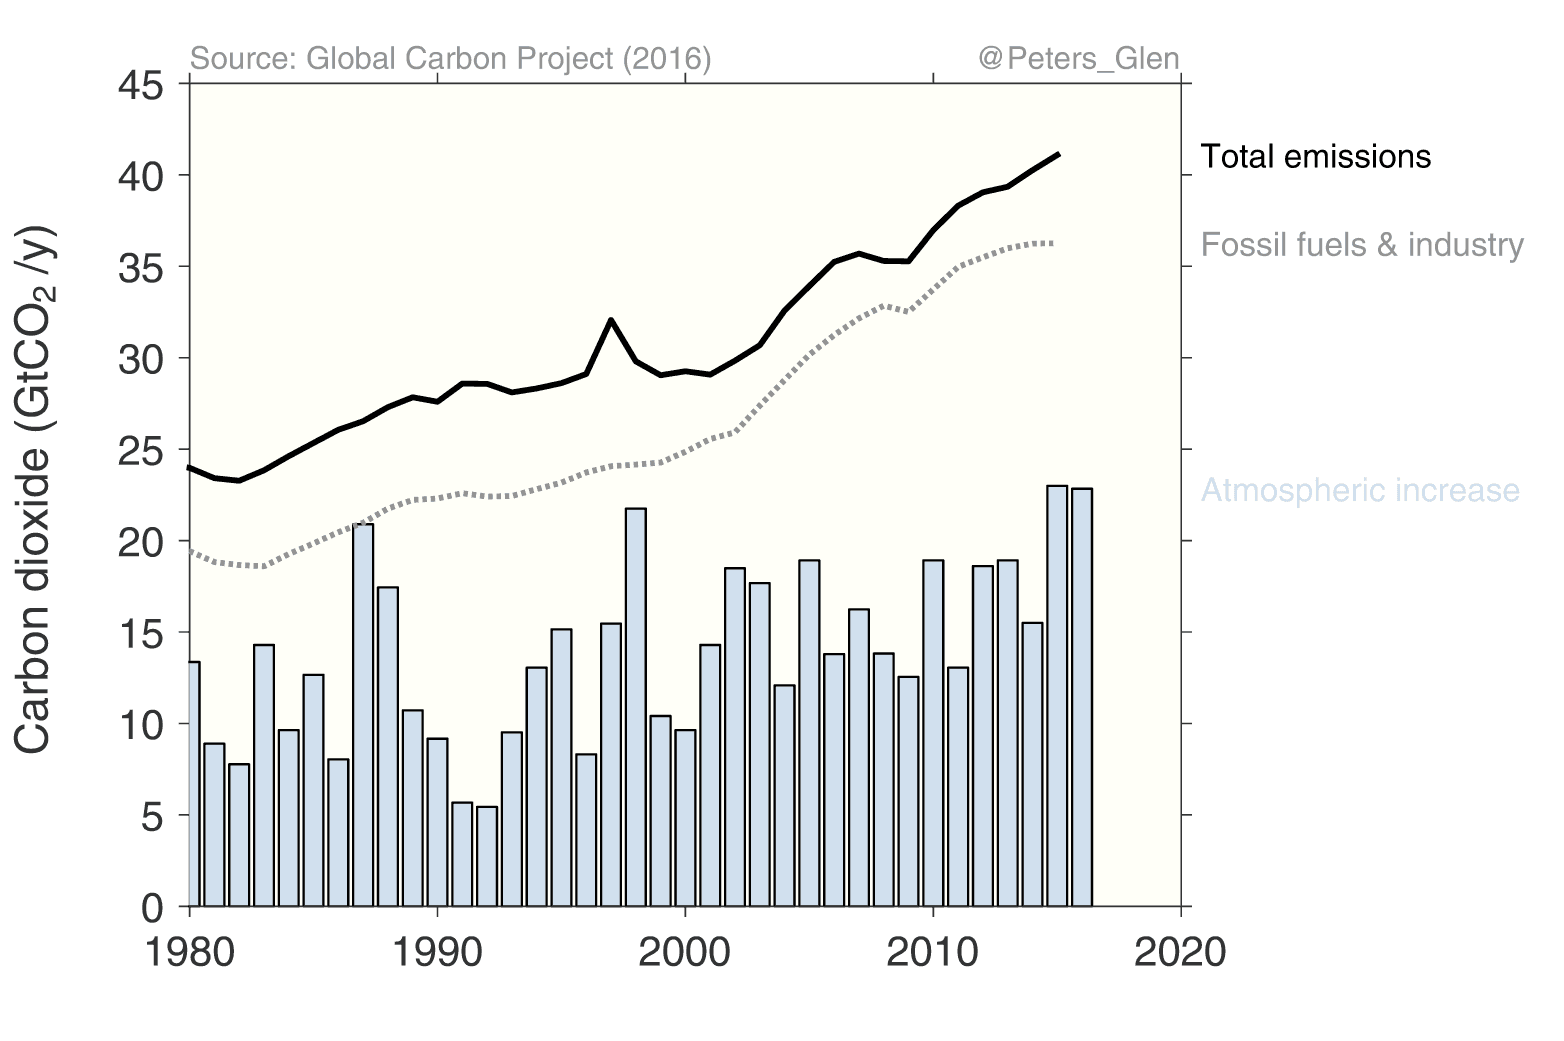
The CO₂ concentration is a stock (like the volume of water in a lake) and the CO2 emissions is a flow (like the river flow into the lake).
What causes the CO₂ concentration to change?
A plot of the CO₂ concentration is a fascinating curve, it shows the planet "breathing" as it goes in and out of seasons. There is more vegetation in the Northern hemisphere, and the CO₂ concentration drops as plants grow in the Northern spring and summer and CO₂ concentrations increase again following decay in autumn and winter.
This seasonal cycle averages out over a year, leading to a continuous increase in CO₂ concentration in the atmosphere due to continued CO₂ emissions.
The annual change in CO₂ concentration is, however, not as smooth as the annual CO₂ emissions. I am not talking about the 400 parts per million in the atmosphere (stock), but the approximate 2 part per million (15 billion tonnes CO₂) annual increase in CO₂ concentrations that we have had in recent years.
The annual increase in CO₂ concentration quite nicely relates to the annual CO₂ emissions and a measure of sea surface temperatures that relates to El Niño events. El Niño events lead to a drying of tropical land regions and more forest fires, and therefore correlate with changes in atmospheric CO₂ concentrations.